Built on Real Data
Reliable data from a nationwide physical device network, enhanced by broad mobile coverage. No opaque or synthetic data source.
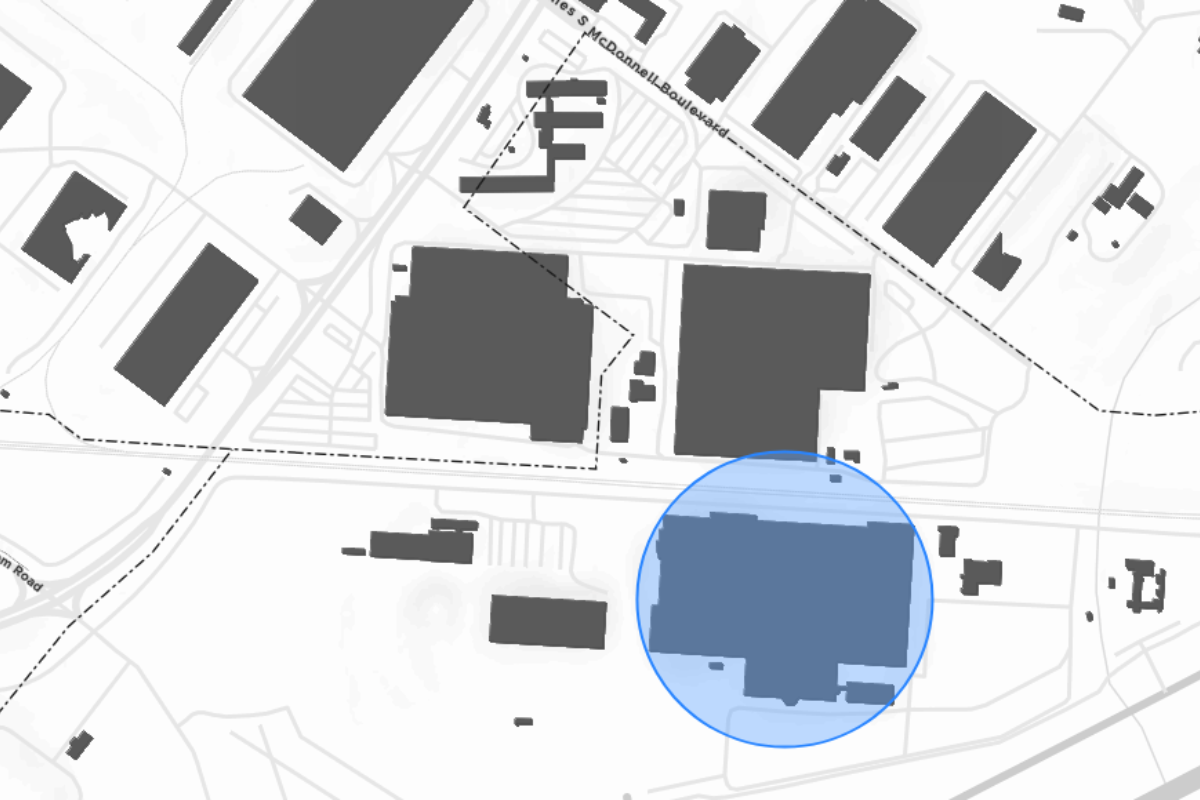
Optimize Every Location Using Real Customer Movement Data
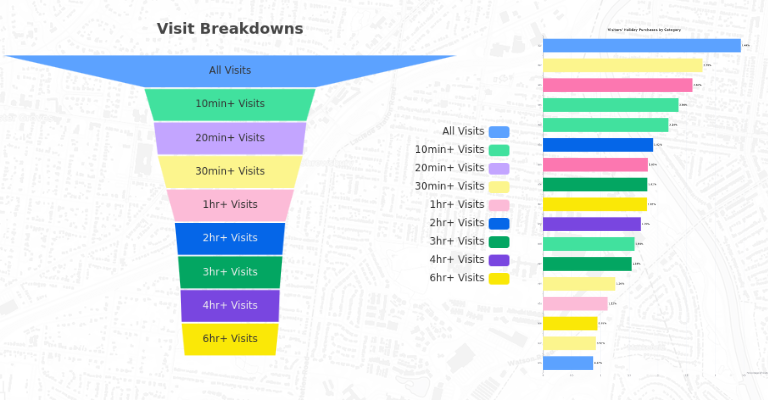
Understand when customers visit, how long they stay, and how often they return, so operational and growth decisions are based on reality, not guesswork.
Use verified visitation data to improve staffing, evaluate promotions, benchmark competitors, and confidently plan new locations.
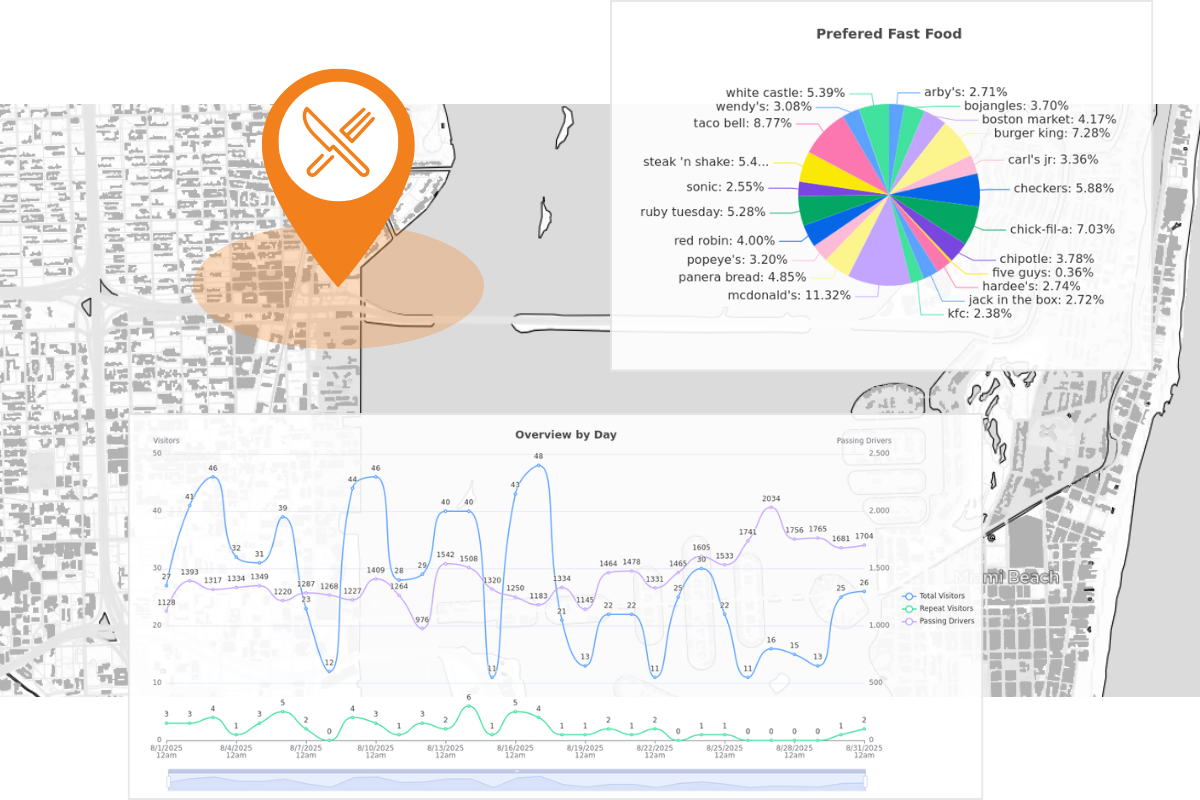
Measure how many customers visit each location, peak hours by daypart, and dwell time to optimize staffing levels, operating hours, and throughput.
Evaluate the real-world impact of promotions, pricing changes, or menu launches by tracking changes in visit frequency and repeat behavior over time.
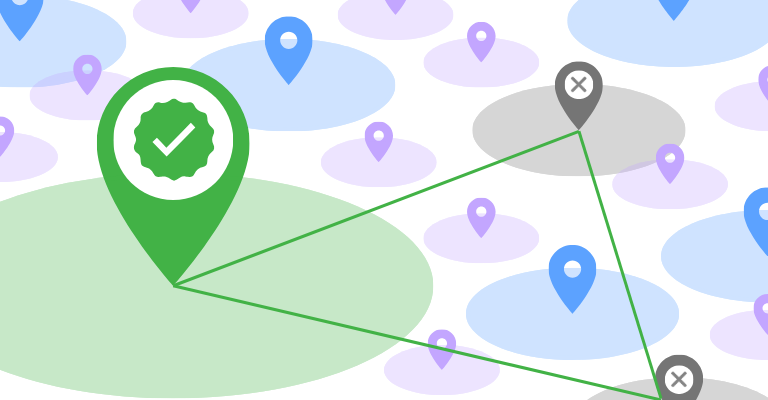
Compare your locations against nearby competitors to understand market share, identify underperforming stores, and uncover opportunities to win incremental traffic.
Analyze traffic volume, consistency, and surrounding activity before opening new locations to reduce risk and improve return on investment.
Reliable data from a nationwide physical device network, enhanced by broad mobile coverage. No opaque or synthetic data source.

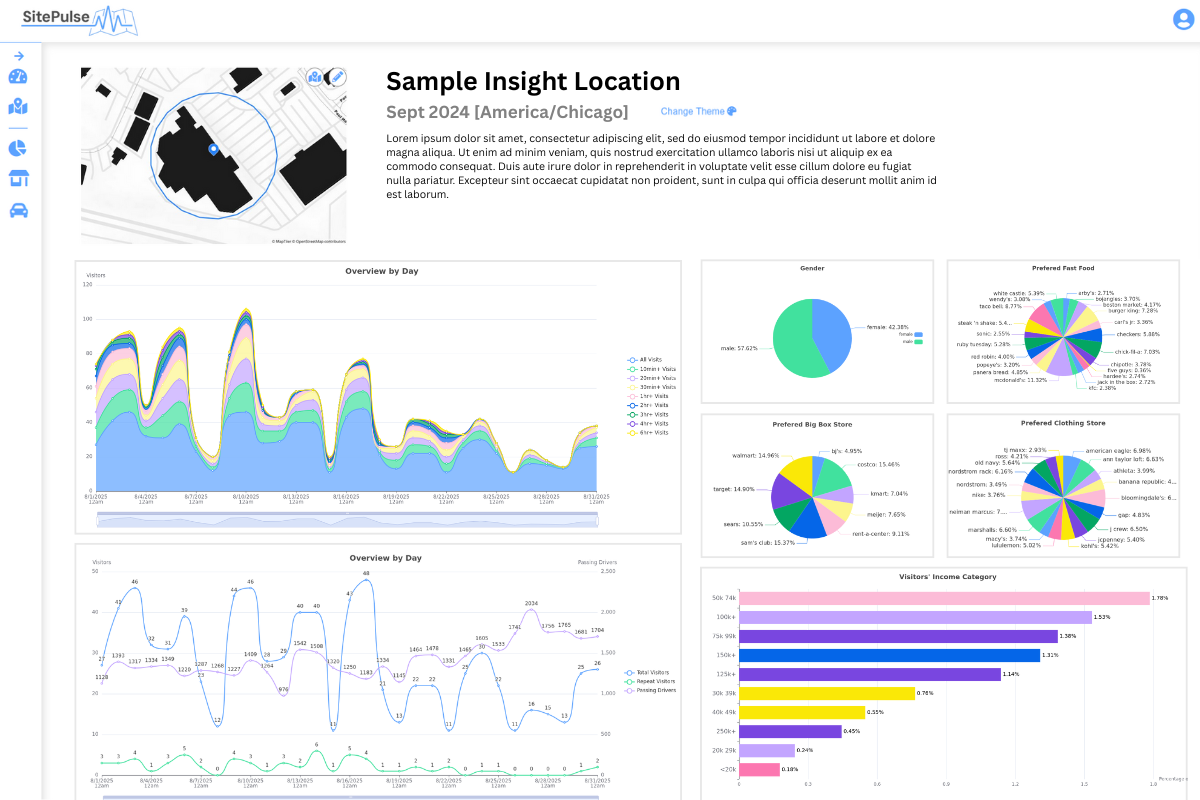
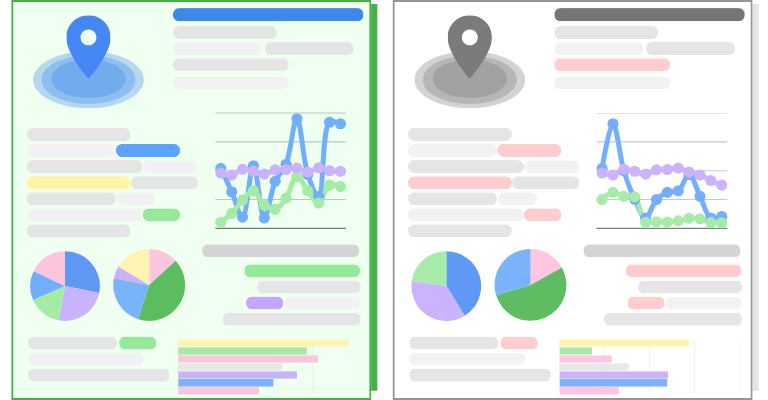
Clear, comprehensive insights at your custom locations without the need for analysts, data queries, or technical overhead.

Our in-house AI model turns complex data into clear visual insights while generating AI-ready prompts for customized consult using external tools.
No subscription. No waste. Our pricing is designed to give you full control over your analytics budget and minimize growth pain.
Prices vary based on length of roadway and number of visitor records. Here presents the pricing expectation for an example location with the following assumptions: