Beyond Mobile Data
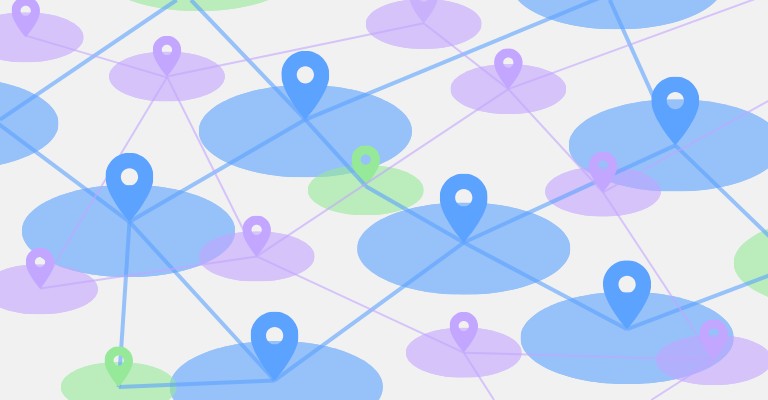
We integrate physical network non-PII device and vehicle data to fill the blindspots other location intelligence platforms miss.
Better decisions start with more accurate location intelligence, cross-validated by a unique IoT sensor network.
Get accurate, cross-validated data and insights into any location at any time from clean and compliant data, backed by real devices. Without hiring your data team, use AI for statistical analysis and report generation.
We integrate physical network non-PII device and vehicle data to fill the blindspots other location intelligence platforms miss.
Proprietary machine learning models built on verified physical sensor data resulting in high confidence analytics you can trust.
For the most accurate result, opt to deploy a device at your location to receive exclusive customer insights.
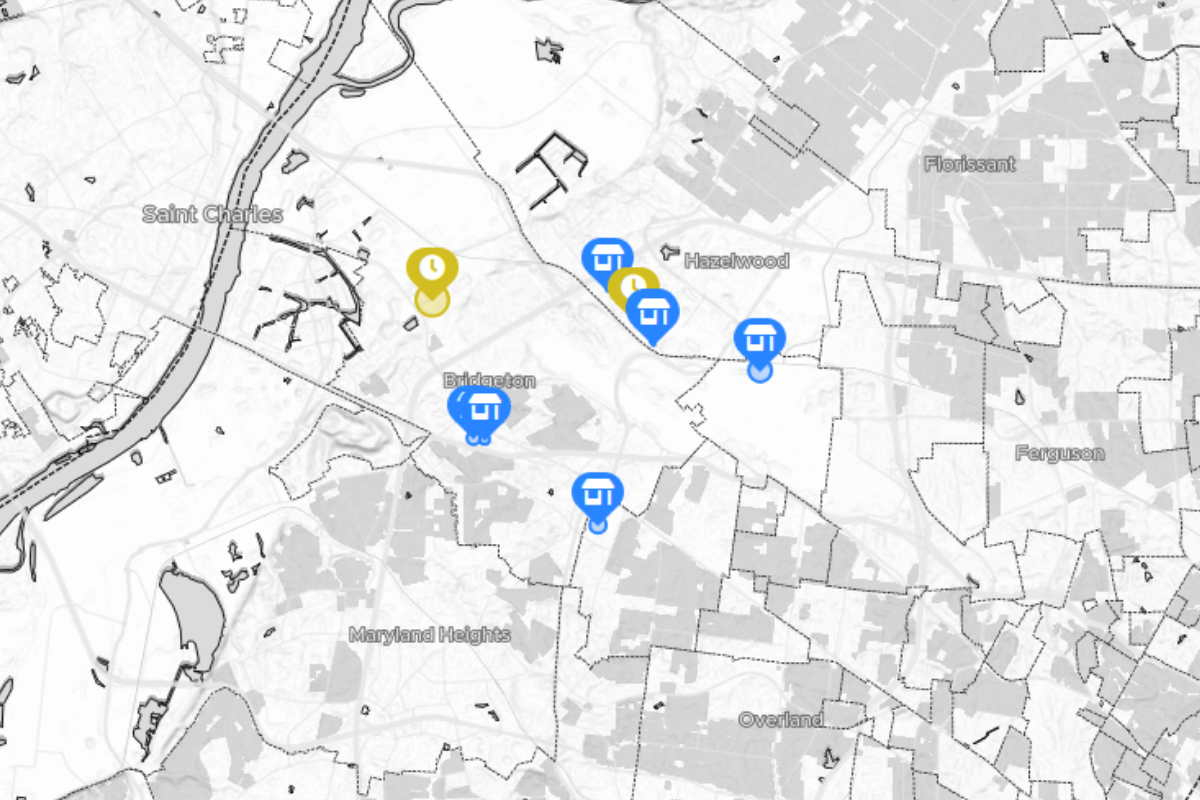
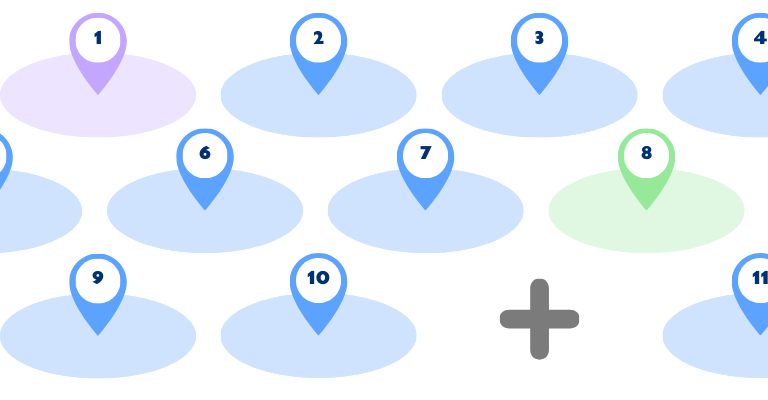
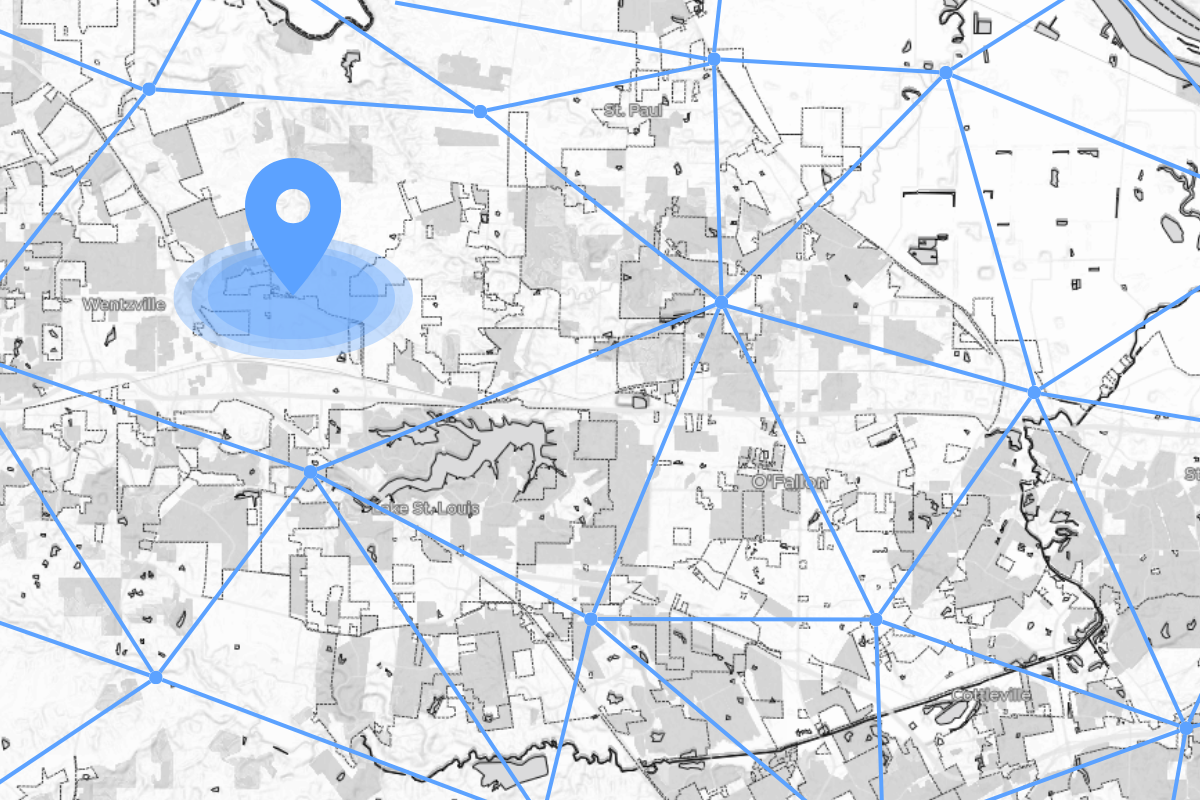
Select a storefront, road section, restaurant, construction site, or any point of interest using the intuitive built-in tool. You can manage as many locations as you wish under the same account. There are 2 types of locations with different types of analytics:
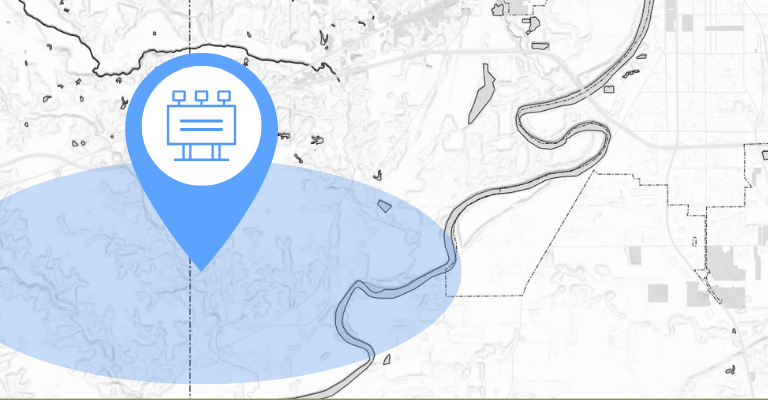
Choose the time range and level of insight for a location, and request the report with pre-purchased credits. You take full control of your analytics budget and only pay for the insights you need. Levels of insights include:
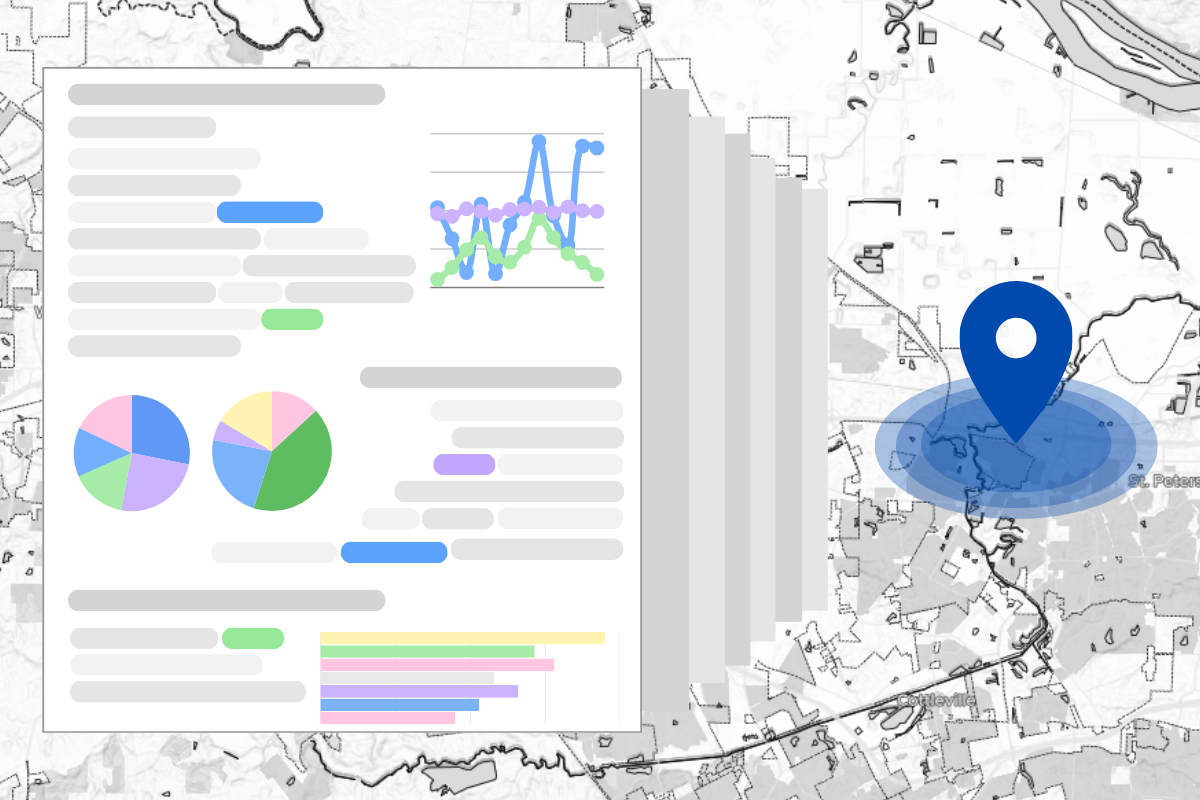
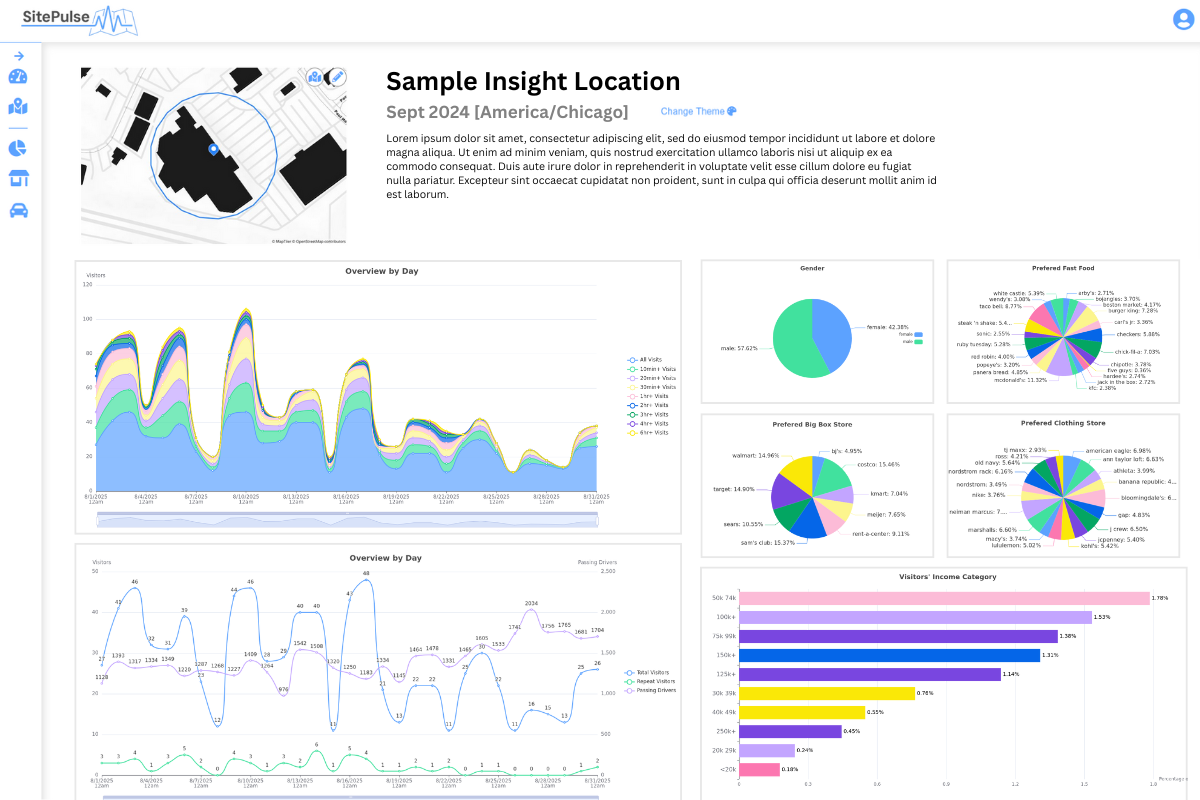
No spreadsheets, no complicated data structure, no SQL experience needed. You do not need a STEM degree to take advantage of data. SitePulse presents data in clear charts and dynamic graphics, delivering the kind of insights normally reserved for enterprises with dedicated data teams. Let SitePulse take care of the technical details, so you can focus on growing your business with better insights.
Price and prove media impact using verified audience and exposure data.
Understand who visits your stores, when, and why they return.
Prove property potential with real traffic, dwell time, and demographics data.
Optimize operations and promotions using true patterns and demographics.
Measure audience demand and optimize venues with real attendance insights.
Turn real-world movement into signals that anticipate market shifts.
Plan safer, smarter cities using real-world movement and activity insights.
We can customize a solution that works with your specific business.
Our pricing is designed to give you full control over your analytics budget and minimize growth pain.